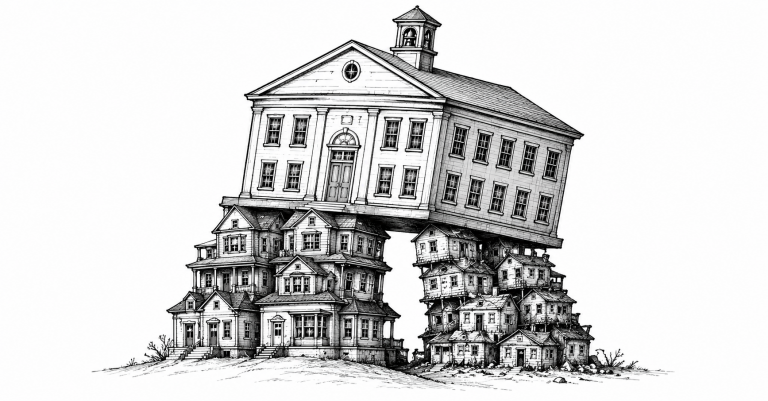
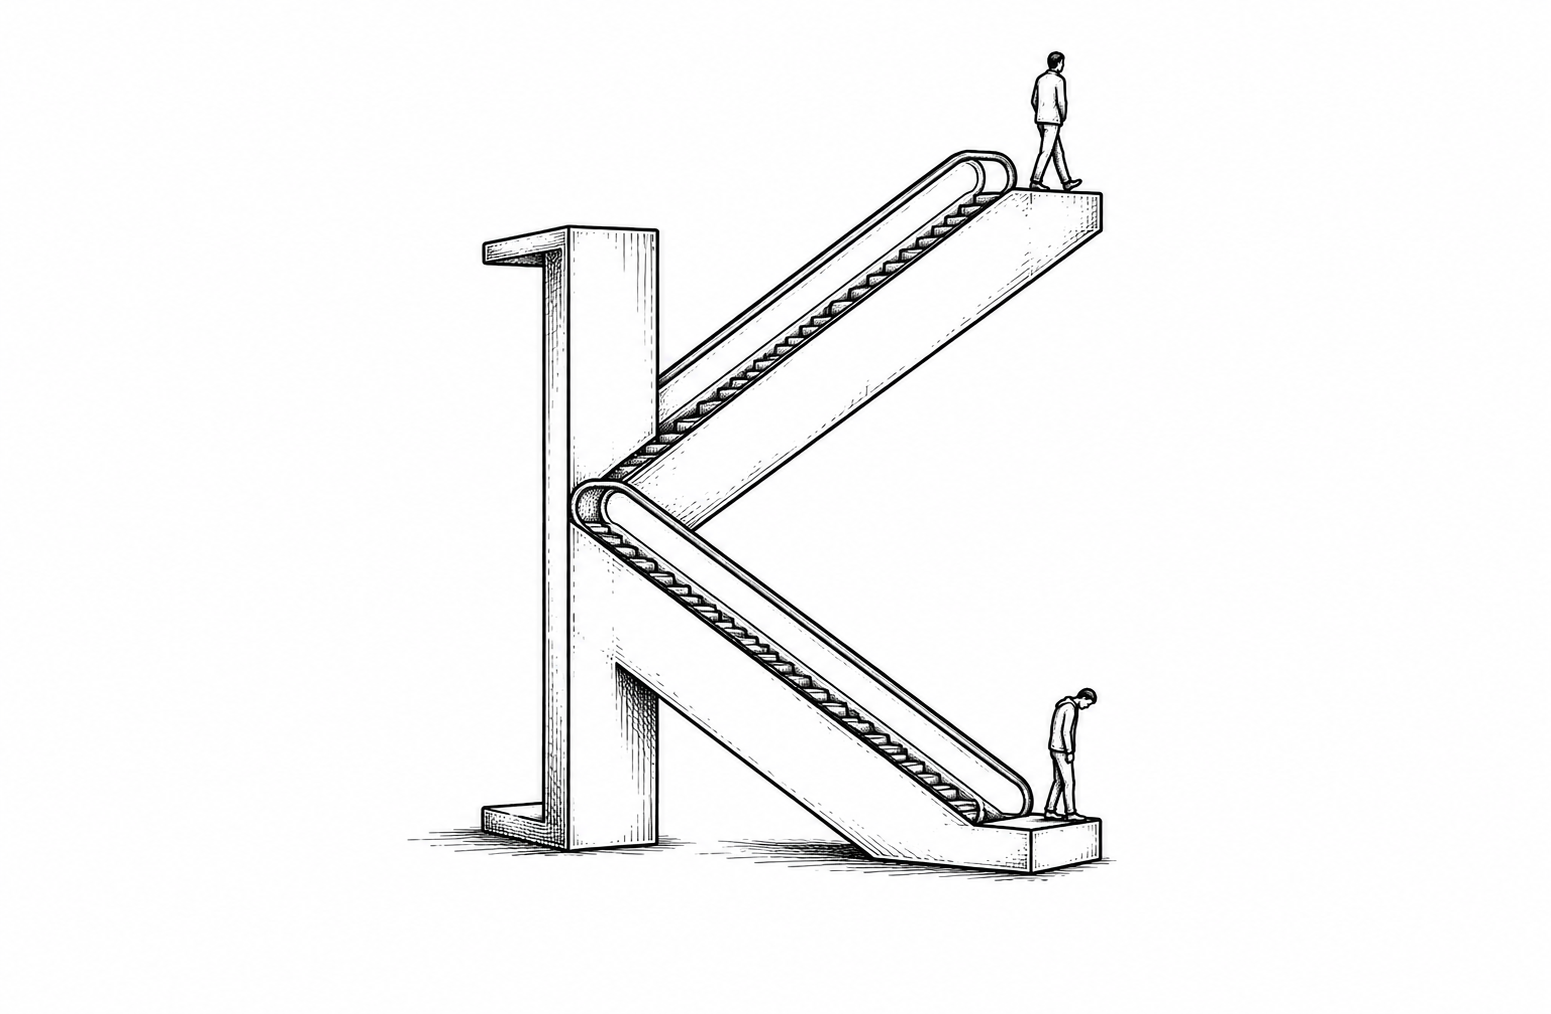
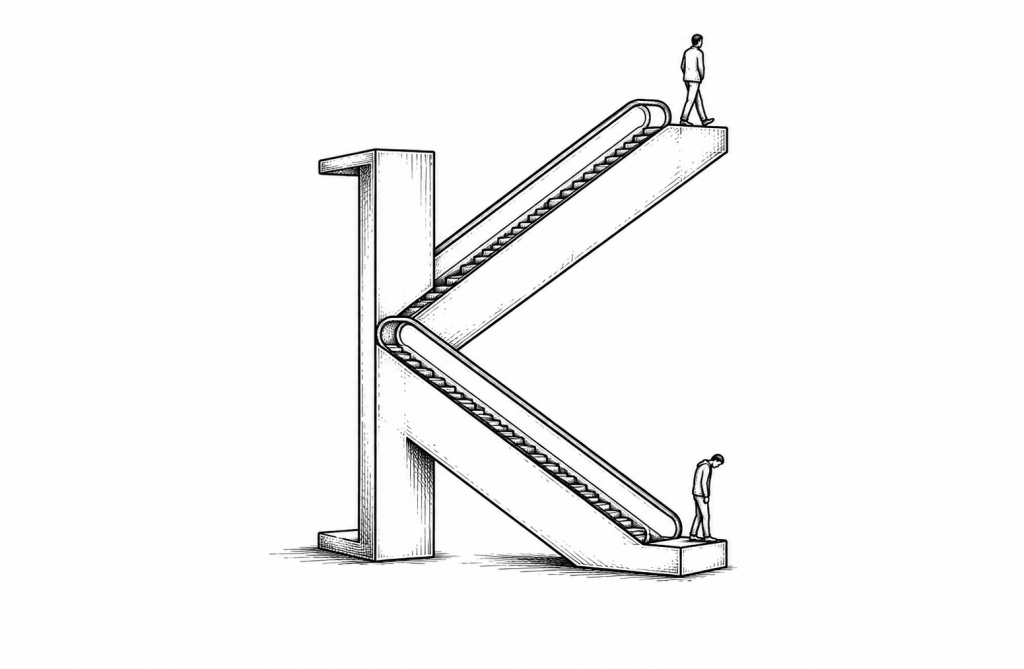
The K-Shaped Economy Has a Floor and a Ceiling. The Floor Is Falling.
Tax cuts skewed toward the top, benefit cuts concentrated at the bottom — the divergence in consumer spending isn’t an accident of the market. It’s the predictable output of who the policy actually serves.
Consumer spending across the U.S. economy remains resilient in aggregate, but the divergence underneath that resilience has widened into what economists at TD Economics, Bank of America, and Yahoo Finance are all now calling a “K-shaped” pattern: higher-income households spending more, lower-income households cutting back, with the two trend lines moving in opposite directions on the same chart. As of Q4 2025, the top 20% of households held nearly 72% of total household wealth. Goldman Sachs Research has revised its 2026 discretionary spending forecast downward twice this year, citing rising energy and food costs that disproportionately burden lower-income consumers, who spend roughly four times as much of their after-tax income on gasoline as the top earners do.
The mechanism driving the divide isn’t abstract market forces. It’s specific policy. TD Economics projects the One Big Beautiful Bill Act’s tax cuts will further entrench the K-shaped pattern in 2026, with nearly 60% of the law’s tax benefits flowing to households earning $217,000 or more, according to Tax Policy Center analysis. At the same time, tighter SNAP eligibility requirements for adults aged 54 to 64 took effect February 1, and the Congressional Budget Office projects reduced SNAP and Medicaid transfers will continue weighing on lower-income households over the medium term. The same legislative act that’s expanding discretionary spending capacity at the top is simultaneously narrowing it at the bottom — not as an unintended side effect, but as the direct distributional consequence of where the tax benefits and the benefit cuts were targeted.
Consumer behavior is adjusting in real time to that squeeze. Two-thirds of consumers told the Conference Board in May they were cutting back on spending overall due to rising prices, with most buying fewer items and delaying expensive purchases. Upside’s 2026 Consumer Spend Report, drawing on more than 10 billion retail transactions, found shoppers becoming less brand-loyal and more willing to split purchases across retailers chasing the best price — what the report calls “uncommitted behavior.” Lower-income households reported cutting back even on non-discretionary categories like fuel and groceries, while higher-income households reported spending the same or more in the same period. Bank of America’s consumer research found that the top third of households by income now drives more than half of all U.S. consumer spending — meaning the economy’s headline spending numbers increasingly describe a shrinking share of the population.
That concentration changes what “resilient consumer spending” actually signals. An aggregate spending number that looks healthy can mask a structure where most of the growth comes from a smaller and smaller share of households, while a larger share of the population spends less every month under the same price pressure. Goldman Sachs forecasts the middle-income quintile will see the strongest discretionary cash growth this year — around 6%, driven specifically by the OBBBA tax cuts — while the bottom quintile sees just 0.8% growth, an order of magnitude smaller. That’s not two groups experiencing the same economy differently. It’s one group’s policy gains showing up as a different group’s policy losses, both flowing through the same GDP figure that gets reported as a single, undifferentiated number.
Power in this dynamic sits with whoever controls the policy levers determining who gets the tax cut and who absorbs the benefit reduction — not with the households on either end of the spending divide, who are responding to conditions set well above them. Bank of America’s own framing is candid about how long this can continue without triggering a broader downturn: “higher- and middle-income households’ consumer spending accounts for the bulk of overall US consumption, so the economy can continue to grow as a ‘K’ for some time.” That’s a forecast that the bottom of the K can keep falling without threatening aggregate growth, for as long as the top of the K keeps climbing fast enough to cover for it. The test of that forecast isn’t whether GDP keeps growing. It’s how long a quarter of U.S. households can keep living paycheck to paycheck inside an economy whose headline numbers say everything is fine.
— SSC Economy Desk | Social Storytellers Collective
Free, daily structural analysis like this lands in your inbox every weekday morning. Subscribe: https://246481934.hs-sites-na2.com/newsletter