
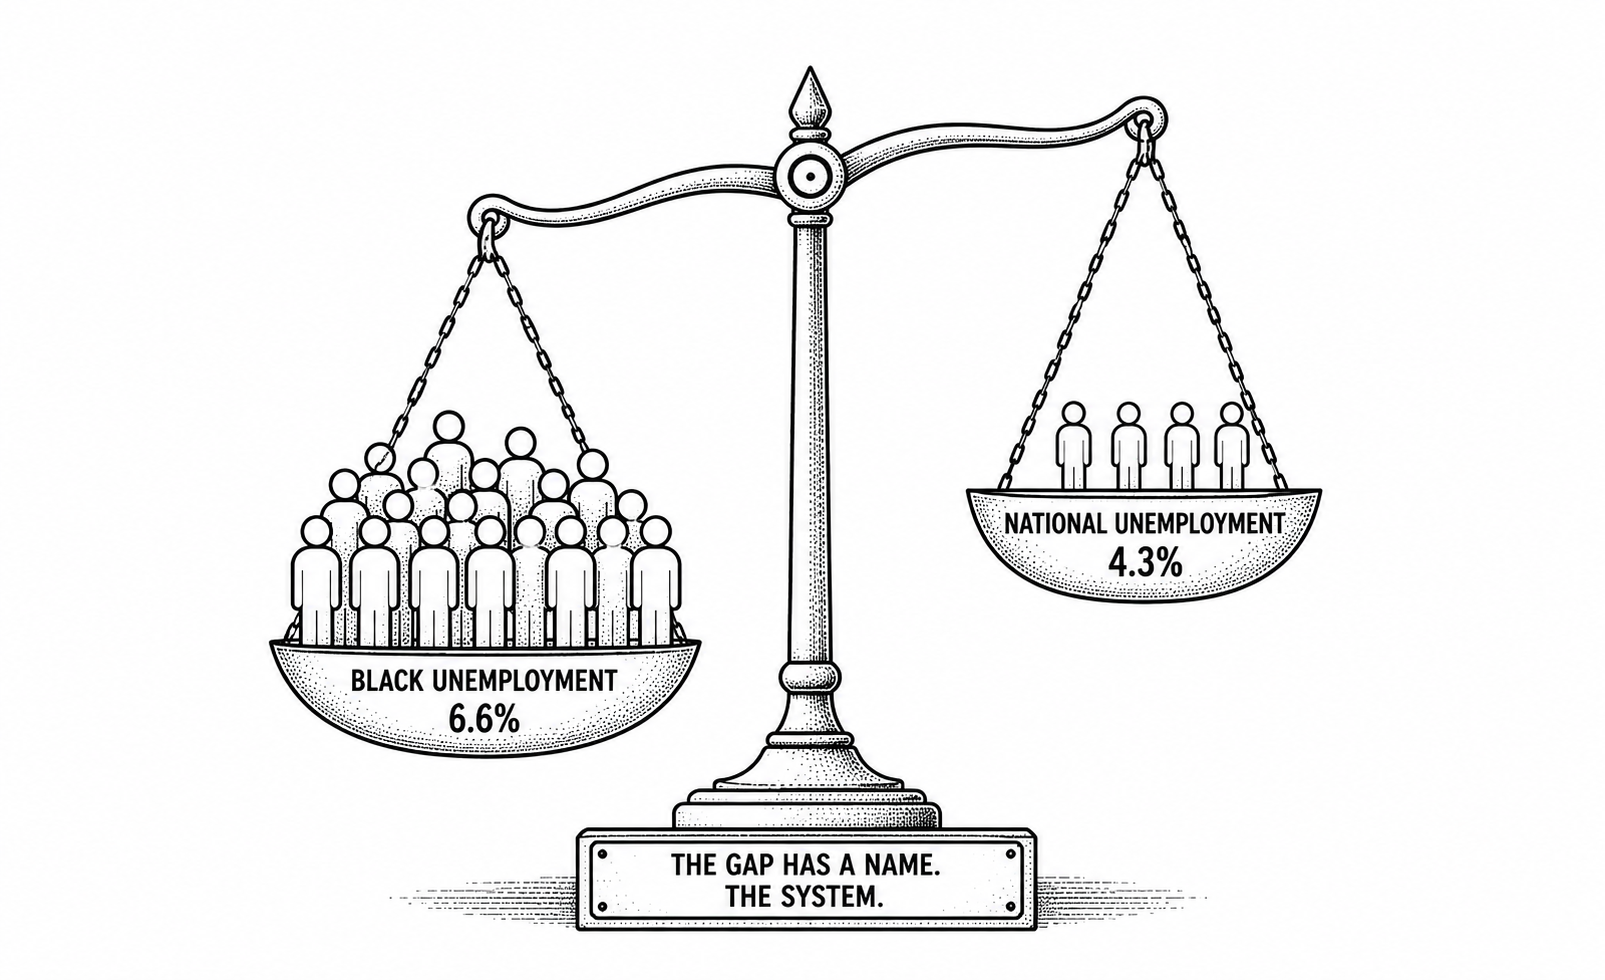
The Black unemployment rate fell too, from 7.3% to 6.6%. Both of those things are true. Neither one changes what the gap between them means.
The Black unemployment rate in May 2026 was 6.6%. The national unemployment rate was 4.3%. The white unemployment rate was 3.8%. The math is familiar: the Black unemployment rate is, as it has been in virtually every month of recorded federal labor data since the BLS began tracking by race, roughly twice the rate for white workers. This is not the result of this economy, or this administration, or this policy moment specifically. It is the result of a labor market architecture that has reproduced this ratio across decades of policy change, economic cycles, and political transitions. The ratio did not appear recently. It has been documented since at least the 1950s. That consistency is the story.
The May numbers contain some real improvement. Black employment increased by 101,000 workers from April to May. The Black women’s unemployment rate dropped from 6.9% to 6.0%. Black men’s rate dropped from 7.6% to 7.3%. These are moves in the right direction, and they should be reported as such. A falling unemployment rate means real people got jobs, and that is not a small thing.
The counterweight is what happened to young Black workers. The unemployment rate for Black workers aged 16 to 24 increased from 13.4% to 14.1% from April to May. Youth unemployment is a leading indicator — it reflects who is entering the labor market and what conditions they encounter. Black youth unemployment at 14.1% while white youth unemployment runs substantially lower is a signal about what is happening at the point of entry into the workforce, not just in aggregate employment figures. Entry-level barriers — criminal record screening, credential requirements, geographic access to job centers, informal hiring networks — concentrate at the front of the career pipeline. The gap there tends to be widest and the least visible in aggregate data.
The structural explanation for the persistent 2-to-1 ratio is not a secret. It is the accumulated result of documented and documented policies: exclusion from unions during the post-war period when union membership was the gateway to middle-class wages; redlining and discriminatory housing policy that determined where Black families could live and therefore which school districts and employer networks their children could access; discriminatory hiring, documented by audit studies that send identical resumes with racially coded names and consistently show callback rate gaps; mass incarceration that removes workers from the labor force and attaches criminal records to the hiring profiles of disproportionately Black men; and the more recent rollback of affirmative action, diversity recruitment programs, and minority business development resources that had begun to narrow the gap in specific sectors.
The Minority Business Development Agency — the only federal agency dedicated specifically to supporting minority-owned businesses — has faced severe cuts and operational disruption under the current administration. The Joint Center for Political and Economic Studies estimates this threatens $10 to $15 billion annually in lost federal support for Black-owned businesses, which are a significant source of employment for Black workers. That policy context shapes the labor market data we are reading.
A 6.6% Black unemployment rate at a moment when federal programs that produced Black employment are being dismantled is not a contradiction. It is a preview of a trend line. One month’s data does not establish a trend. But the policy environment in which the data is being generated does. The question worth asking when the next report drops — or the one after that — is not just whether the number went up or down, but whether the structural conditions that have held the ratio at 2-to-1 for 70 years are being changed, maintained, or made worse.
They are not being changed.
Sources: Bureau of Labor Statistics, “The Employment Situation — May 2026,” June 2026. Joint Center for Political and Economic Studies, “May 2026 Jobs Day Analysis,” June 2026. NCRC, “Black Men Face a Worsening Jobs Market: May 2026 Race, Jobs and Economy Update,” June 2026. Economic Policy Institute, “State Unemployment by Race and Ethnicity, 2026 Q1.”