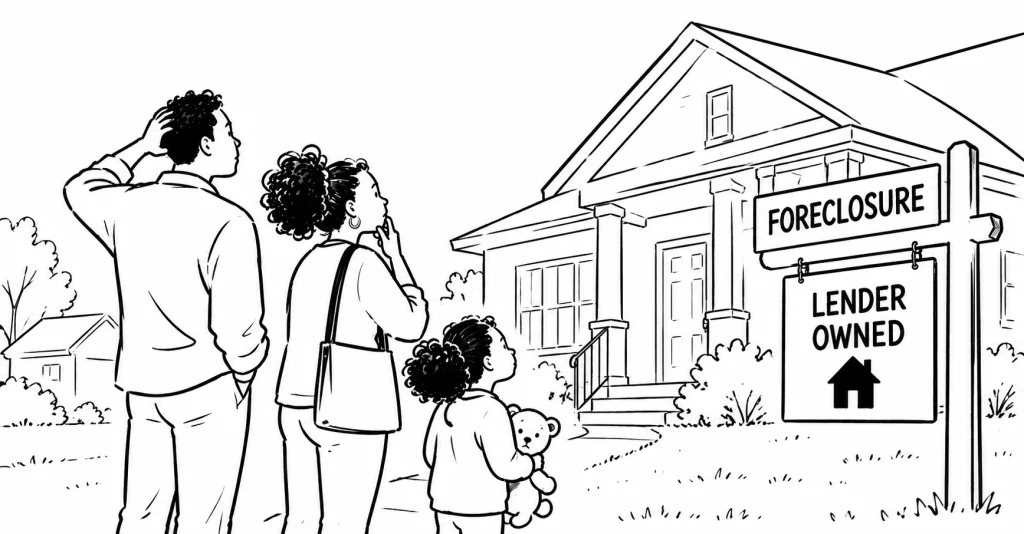
The latest national figures show rising foreclosure activity as 2026 heads into its final quarter. The pressure is uneven—and the headline filing count does not tell the whole story.
Lenders repossessed 5,794 U.S. properties through completed foreclosures in August, up 42% from a year earlier, according to ATTOM’s August 2026 foreclosure report. Across all stages of the process, 40,277 properties received foreclosure filings, an increase of 13% from August 2025. Released September 17, the report provides a recent national snapshot as the housing market enters the final quarter of the year. Its findings show pressure at both ends of the process: properties entering foreclosure and properties being taken back by lenders. For homeowners already struggling, the concern extends beyond whether they can buy a home to whether they can keep the one they have.
A Filing Does Not Always Mean a Home Was Lost
The broad foreclosure total includes default notices, scheduled auctions and bank repossessions. It should not be read as 40,277 households losing their homes in August. Lenders started foreclosure on 25,894 properties, up 7% annually but down 3% from July; repossessions rose 22% from the previous month. These measures describe different stages, and the properties completing foreclosure were not necessarily those entering it that month. The sharper increase in repossessions makes the outcome of older cases worth watching alongside new starts. It also cautions against treating one month’s activity as a direct measure of how many homeowners recently fell behind.
The increase extends beyond the latest monthly release. ATTOM’s midyear report counted 227,548 properties with foreclosure filings during the first six months of 2026, up 21% from the same period in 2025. Lenders repossessed 27,983 properties, a 33% annual increase. Those figures give the August results a longer frame: foreclosure activity was already rising during the first half of the year. They do not, however, establish why individual borrowers encountered trouble. The records measure movement through a legal and financial process, rather than identifying how much of the increase came from lost income, household expenses or other circumstances.
National Pressure Has Different Local Consequences
Texas illustrates why foreclosure volume and foreclosure rates need separate attention. In July’s national report, the state led in new foreclosure starts, with 3,306, while Nevada had the highest filing rate relative to its housing stock. A large state can produce more cases without having the highest share of homes affected. For local officials and housing organizations, both measures are useful: volume helps indicate the scale of demand for assistance, while rates show how concentrated the problem is. National totals establish the direction of activity, but they cannot describe the intensity of pressure in every community.
The time available to resolve a case also varies substantially. Properties completing foreclosure in the second quarter had spent an average of 563 days in the process, according to ATTOM’s midyear analysis. Texas averaged 155 days. These are retrospective averages for completed cases, rather than deadlines that every borrower can expect. Still, the variation points to a practical limitation in national coverage: homeowners facing similar financial problems may encounter very different timelines. The useful local questions concern when assistance becomes available, how quickly a borrower’s case advances and whether there is enough time to pursue an alternative before the property changes hands.
A Resilient Market Can Still Contain Households in Trouble
ATTOM describes foreclosure volumes as remaining below historical norms, even with the annual increases. Its July assessment characterized the broader market as relatively resilient while acknowledging financial pressure on some homeowners. That combination calls for measured interpretation. The figures support concern about rising foreclosure activity, but they do not by themselves establish a nationwide housing collapse. Market stability and household stability operate at different scales: a housing system can absorb additional foreclosures while the affected owners face consequential losses. Assessing the trend requires watching its size, persistence and location without allowing either a dramatic percentage increase or a reassuring market description to stand alone.
As the year closes, the next reports should clarify whether new starts continue rising and whether elevated repossessions persist. Those trends will be more informative than a single headline percentage, especially when examined alongside local conditions and borrowers’ ability to resolve delinquency. Housing coverage also needs to follow what happens before the final transfer: whether assistance reaches owners, whether repayment arrangements hold and whether households retain a workable path to staying. The emerging national story is about the durability of homeownership after purchase—and how many owners can recover when that commitment becomes difficult to sustain.