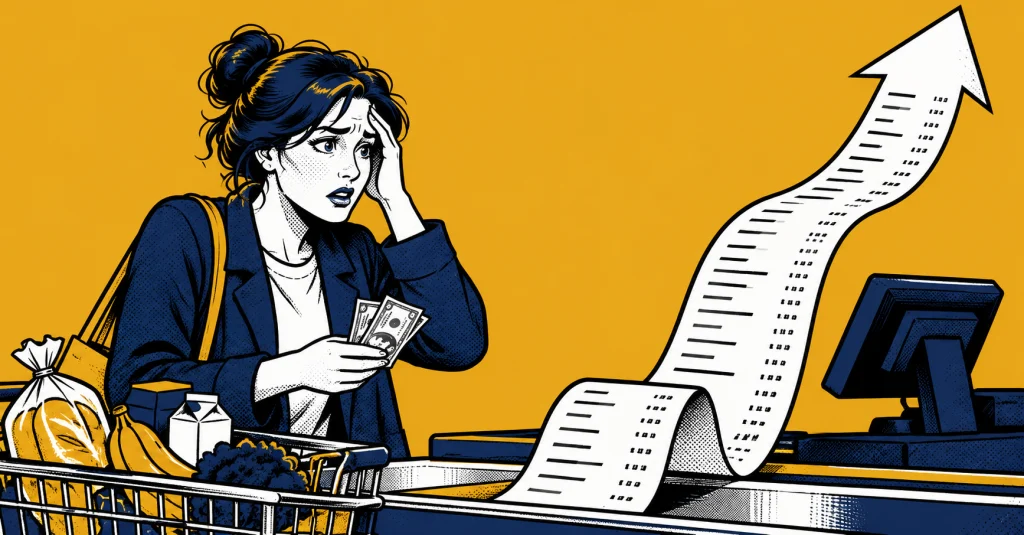
AP’s numbers put the economy between Donald Trump’s claims and voters’ mood, and the split between who pays for the Iran war’s price shock and who owns the market’s gains explains the gap.
Associated Press reporters Josh Boak and Melissa Goldin reported on October 21 that Donald Trump is telling voters before the November 3 midterms that the economy is surging, while voters point to gasoline prices pushed up by the Iran war, expensive groceries and interest rates that make homes and cars harder to afford. AP’s read of the data puts the economy between the two accounts: weaker than Trump claims and stronger than consumer sentiment surveys suggest. Trump told an Ohio crowd on October 3 that inflation was almost nonexistent, but the Labor Department reported consumer prices up 3.7% over the 12 months ending in September, compared with 3.4% in August and roughly 3%when he returned to office in January 2025.
An economy can grow while most households lose ground, because the gains and the costs land on different people. Inflation is the cost side. AP traced the renewed climb to the sweeping tariffs Trump announced in April 2025, and the Bureau of Labor Statistics found gasoline prices rose 9.1% in September alone after the war began. A household pays that bill at the pump and the register within the same week it arrives. The White House has described the energy spike as a short-term disruption, and Trump said in Arizona that prices should fall when the war ends, which he said would come very soon.
Low unemployment hides a slow hiring machine. The rate sits at 4.2%, but employers have added an average of almost 39,000 jobs a month in Trump’s second term, compared with more than 121,000 a month in the year before he returned, AP reported. Economists describe the arrangement as “low hire, low fire,” which protects people who already have jobs and offers little to people looking for one. Trump’s immigration crackdown also shrinks the labor force, so unemployment can stay low even as hiring slows, and the rate for U.S.-born workers has held largely steady, which suggests they are not filling the jobs immigrants left.
Borrowing costs move the pain from the pump to the mortgage. Interest on the 10-year Treasury note is above 5%, the highest level since 2002, driven by a rising national debt, persistent inflation and the war-related energy spike. A buyer pays that rate on a home or a car loan, and the federal government pays it when it repays its bonds. The same rate pays lenders and bondholders more.
The stock market is where the gains collect. The S&P 500 is up about 12% this year after rising about 16.4% last year, though it also gained 23.3% in 2024, before Trump took office, so record highs say little about any one president’s policies. What matters is who holds the shares. According to Federal Reserve data, the wealth of the top 0.1% of households has grown by $5.5 trillion in 18 months, while the bottom 50% have gained $380 billion. That works out to about $5,600 per household in the bottom half and $40.8 million per household at the top, more than 7,000 times as much.
A record stock market reports how asset owners are doing, and it says little about someone who owns no shares and buys gasoline. That is the gap between the data and the mood: sentiment surveys register the cost side, which most households feel directly, while the headline numbers on growth and stocks register the gains, which reach fewer of them.
The next inflation report arrives on November 10, a week after voters decide, so the election will turn on the numbers and receipts already in hand. Whichever party holds Congress in January will inherit an economy where wealth rises fastest for people least exposed to gas prices and mortgage rates, and that split will keep producing consumer surveys that contradict the headline figures.