
AP reporters Christopher Rugaber and Paul Wiseman reported Thursday that the Commerce Department‘s key inflation gauge hit 3.8% in April — the highest reading since May 2023. Americans’ after-tax, inflation-adjusted incomes fell for the third consecutive month. Adjusted for inflation, spending rose just 0.1%. The U.S. economy, in the same reporting period, grew at a 1.6% annual pace.
Both figures are accurate. They are not describing the same people.
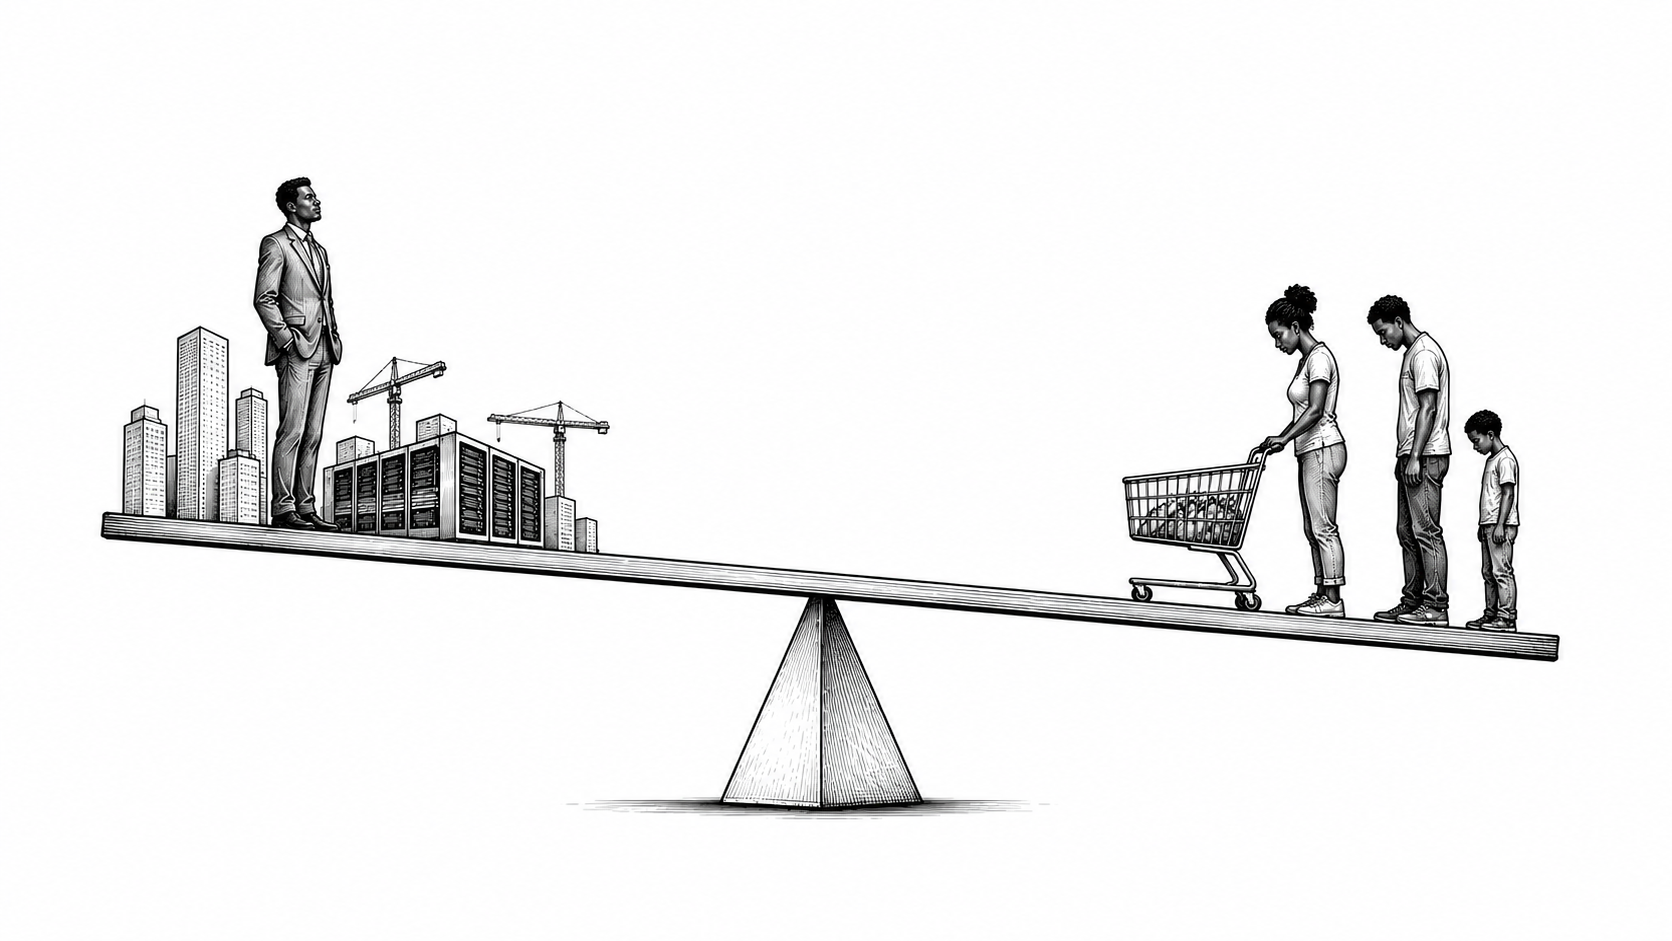
The Commerce Department report contains one sentence that explains the apparent contradiction: resilient consumer spending is being driven primarily by upper-income households, while ongoing AI infrastructure investment is sustaining business investment figures. Strip those two variables out and what remains is an economy where working and middle-class households are losing purchasing power in real terms every month — and the aggregate number is not built to show that.
This is how GDP growth and household financial stress coexist without contradiction. GDP measures the total output of the economy. It does not measure how that output is distributed. When AI infrastructure investment grows at 7% annually and upper-income spending holds steady, the aggregate stays positive. When real incomes fall, groceries cost more, gas averages $4.50 a gallon — up from $2.98 the day before the Iran war began, according to AAA — and inflation-adjusted spending barely moves, those signals do not displace the aggregate. They get averaged into it.
The mechanism producing this divergence is not accidental. It is the logical output of an economy that has, over several decades, built its growth infrastructure around capital accumulation rather than wage growth. AI infrastructure investment is the current expression of that architecture: billions of dollars flowing into data centers, compute, and model development — assets owned by a small number of companies, generating returns for a small number of shareholders — while the same technology is used to justify the workforce reductions that are compressing labor income at the bottom.
Gas prices up 51% since the Iran war began. Groceries rising. Electricity spiking. Core inflation at 3.3% — its highest since October 2023. Real household income down three consecutive months. And Treasury Secretary Scott Bessentcalling it “transitory” — the same word former Fed Chair Jerome Powell used to describe the 2021–22 inflation spike that became the central argument in Trump’s campaign for a second term.
Dan North, senior economist at Allianz Trade North America, told AP the direction is clear: “It’s the wrong way, and we think it will continue in the wrong way because there are so many inflation pressures in the pipeline.” Joe Brusuelas, chief economist at RSM, named what the household data is actually showing: “Signs of stress are building inside the American household across the economy.”
The Federal Reserve targets 2% inflation. At 3.8%, several officials have signaled the most significant move under new Fed Chair Kevin Warsh may be a rate hike rather than a cut. Higher borrowing costs for mortgages, car loans, and credit cards would arrive on top of three consecutive months of declining real income — for the households already absorbing the full weight of an inflationary cycle that the aggregate growth number was never designed to register.
The economy is growing. The people carrying it are not the people paying for it. That gap is not a data anomaly. It is a design feature — and the April report is the clearest documentation yet of how wide it has become.
Get SSC analysis delivered to your inbox every day. Subscribe free on Beehiiv: socialstorytellerscollective.beehiiv.com